一、QCustomPlot简介
QCustomPlot是一个用于编写可视化图表的 QT C++库。
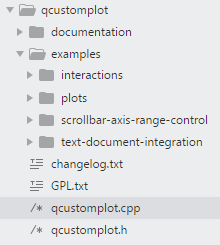
目录结构
qcustomplot.cpp、qcustomplot.h为源码文件,需要添加到自己的工程中。
example文件夹下有4个官方提供的demo,编译后可以直接运行。

二、使用
本文举的例子:不断接收指定数据,实时刷新图表,最终绘制成一副完整的图表。
本文编写时使用版本:
Version: 2.0.0
1、引入QCustomPlot
将源码文件添加到工程中。
qcustomplot.cpp
qcustomplot.h
2、创建plot
 1
 2
 3
 4
 5
 6
 7
 8
 9
10
11
12
13
14
15
16
17
18
19
20
21
22
23
24
25
26
27
28
29
30
31
32
33
34
35
36
37
38
39
40
41
42
43
44
45
46
47
48
49
50
|
void MainWindow::plotsInit(void)
{
    customPlot = new QCustomPlot(this);
    customPlot->setGeometry(screen_w*0/1024, screen_h*120/600, screen_w*1024/1024, screen_h*470/600);//设置曲线系坐标

    customPlot->yAxis->setLabel(tr("压力(Pa)"));
    customPlot->legend->setVisible(true);

    //添加第一条曲线
    customPlot->addGraph();
    QPen bluePen;
    bluePen.setColor(QColor("#33CCCC"));
    bluePen.setWidthF(2.5);
    customPlot->graph(0)->setPen(bluePen);
    customPlot->graph(0)->setName(tr("数据1"));
    //曲线上数据点的样式,大小;这里设置为空心圆
    customPlot->graph(0)->setScatterStyle(QCPScatterStyle(QCPScatterStyle::ssCircle, 5));

    //添加第二条曲线
    customPlot->addGraph();
    QPen greenPen;
    greenPen.setColor(QColor("#0066CC"));
    greenPen.setWidthF(2.5);
    customPlot->graph(1)->setPen(greenPen);
    customPlot->graph(1)->setName(tr("数据2"));
    customPlot->graph(1)->setScatterStyle(QCPScatterStyle(QCPScatterStyle::ssCircle, 5));

    //添加第三条曲线
    customPlot->addGraph();
    QPen redPen;
    redPen.setColor(QColor("#FF3366"));
    redPen.setWidthF(2.5);
    customPlot->graph(2)->setPen(redPen);
    customPlot->graph(2)->setName(tr("数据3"));
    customPlot->graph(2)->setScatterStyle(QCPScatterStyle(QCPScatterStyle::ssCircle, 5));

    customPlot->axisRect()->insetLayout()->setInsetAlignment(0, Qt::AlignTop|Qt::AlignRight);//标签位置

    // set blank axis lines:
    customPlot->xAxis->setTicks(true); //刻度
    customPlot->yAxis->setTicks(true);
    customPlot->xAxis->setTickLabels(true);  //文本
    customPlot->yAxis->setTickLabels(true);
    // make top right axes clones of bottom left axes:
    /*
      一个默认的坐标轴矩形配置,包括:顶部坐标轴跟随底部坐标轴同步、右侧坐标轴跟随左侧坐标轴同步,
      不仅仅是坐标轴范围跟随同步,包括文本精度、文本格式、坐标轴类型、是否自动生成刻度、刻度间距等等。
    */
    customPlot->axisRect()->setupFullAxesBox();
}
|
3、回调函数(QT槽函数)
通过QT中的信号和槽机制,外部发送Signal来调用槽函数。
以下(2)举例,创建信号和槽:
1
2
|
changePlotsRangeSignal = new SIGNALS();
connect(changePlotsRangeSignal,SIGNAL(changePlotsRangeSignal()), this, SLOT(changePlotsRangeCb()));
|
外部调用:
1
|
changePlotsRangeSignal->sendChangePlotsRangeSignal();
|
(1)接收数据,实时刷新UI
每接收到一次数据时,调用该函数,实时刷新图表。
 1
 2
 3
 4
 5
 6
 7
 8
 9
10
11
12
13
14
15
16
17
18
19
20
21
22
23
24
25
|
int data_size = 10000;
QVector<double> data1_x_(data_size), data1_y_(data_size);
QVector<double> data2_x_(data_size), data2_y_(data_size);
QVector<double> data3_x_(data_size), data3_y_(data_size);
int recv_count = 0;
void MainWindow::changePlotsDataCb(float data1_x, float data1_y, float data2_x, float data2_y, float data3_x, float data3_y)
{
    data1_x_[recv_count] = data1_x;
    data1_y_[recv_count] = data1_y;
    data2_x_[recv_count] = data2_x;
    data2_y_[recv_count] = data2_y;
    data3_x_[recv_count] = data3_x;
    data3_y_[recv_count] = data3_y;
    recv_count ++;

    customPlot->graph(0)->setData(data1_x_, data1_y_);
    customPlot->graph(1)->setData(data2_x_, data2_y_);
    customPlot->graph(2)->setData(data3_x_, data3_y_);

    customPlot->graph(0)->rescaleAxes(true); //坐标轴自适应
    customPlot->graph(1)->rescaleAxes(true); //坐标轴自适应
    customPlot->graph(2)->rescaleAxes(true); //坐标轴自适应

    customPlot->replot();  //重绘
}
|
(2)修改图表比例
数据接收完毕后调用一次,缩放图表,优化显示效果。
1
2
3
4
5
6
7
|
void MainWindow::changePlotsRangeCb()
{
    // zoom out a bit:
    customPlot->yAxis->scaleRange(1.1, customPlot->yAxis->range().center());
    customPlot->xAxis->scaleRange(1.1, customPlot->xAxis->range().center());
    customPlot->replot();
}
|
(3)清除图表数据
1
2
3
4
5
6
7
|
void MainWindow::clearPlotsDataCb()
{
    customPlot->graph(0)->data().data()->clear();
    customPlot->graph(1)->data().data()->clear();
    customPlot->graph(2)->data().data()->clear();
    customPlot->replot();
}
|
若之前调用过(2),那么清除后需要将图表比例复原。
customPlot->yAxis->scaleRange(0.9, customPlot->yAxis->range().center());
customPlot->xAxis->scaleRange(0.9, customPlot->xAxis->range().center());
4、效果预览

5、代码下载
Demo地址
三、推荐资料
一共7篇文章,介绍的比较详细。
一些图表初始化时常用的设置

